What does a pound of coffee cost in the United States, and what does that mean for a cup made at home? This page answers both with government data. It tracks the U.S. Bureau of Labor Statistics (BLS) average retail price for 100% ground roast coffee every month since January 1980, restates that price in today’s dollars, and converts it into a cost per cup using published brewing ratios. Data through August 2026; the page is refreshed after each monthly BLS release.
Key figures
- $9.30 per pound was the U.S. average retail price of 100% ground roast coffee in August 2026, below the series high of $9.72 in April 2026 (the series starts in January 1980).
- The consumer price index for coffee rose 6.1% in the 12 months to August 2026, compared with 2.2% for all food at home and 3.4% for all items. BLS recommends its price indexes, not average prices, for measuring price change.
- Since January 2020, the coffee index is up 56%, against 32% for food at home and 30% for all items. Over the same period the average price per pound went from $4.17 to $9.30 (+123%); the two measures differ, and BLS recommends the index for price change.
- Restated in August 2026 dollars, the highest average price in the series was $13.83 per pound, in February 1980; the lowest was $4.86, in June 2004.
- At 1 gram of coffee per 16 grams of water, a pound of ground coffee makes about 31 eight-ounce cups, so the August 2026 average price works out to about $0.30 per cup. At a stronger 1:13 ratio it is about $0.37 per cup.
Coffee prices since 1980
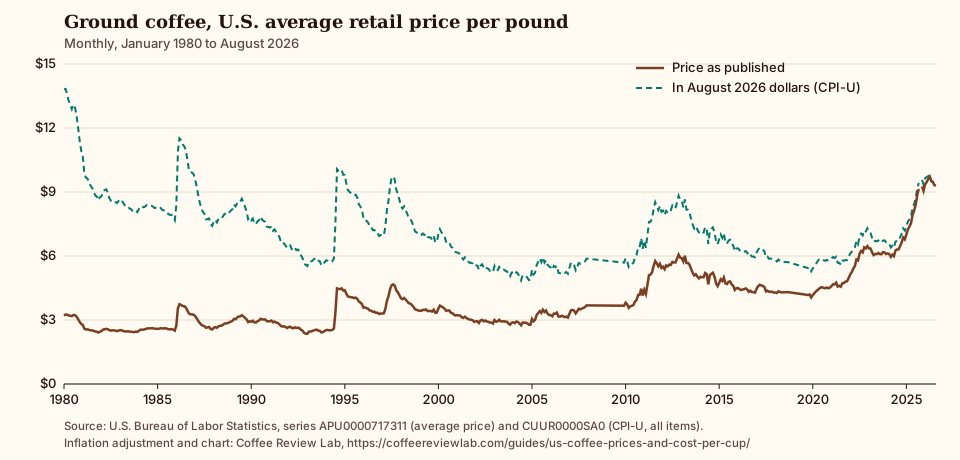
The solid line is the average price as BLS published it each month. The dashed line restates every month in today’s dollars using the consumer price index for all items, so a 1980 price and a 2026 price can be compared in the same money. The two lines meet at the latest month.
Cost per cup of coffee at home
The cost of a cup depends on three things: what you pay for the coffee, how much coffee you use per cup, and how big the cup is. The National Coffee Association’s brewing guidance puts pour-over coffee at 1 gram of coffee to 13 to 16 grams of water, and French press coffee at 1 gram to 10 to 16 grams of water. This page uses 1:16, the leanest ratio both ranges share, for its standard cup, and shows 1:13 as a stronger alternative. An “8-ounce cup” here means 8 fluid ounces of brewing water.
Interactive calculation
Coffee cost per cup calculator
Enter what you pay for a bag and how you brew. The price starts at the BLS average for August 2026; replace it with your own receipt.
The calculation is simple enough to check by hand:
- Coffee per cup (grams) = water per cup in fluid ounces × 29.57 ÷ ratio. At 8 fluid ounces and 1:16, that is about 14.8 grams.
- Cups per bag = bag weight in ounces × 28.35 ÷ grams per cup. A 16-ounce bag (1 pound) gives about 30.7 cups at that dose.
- Cost per cup = bag price ÷ cups per bag.
Two practical notes. For pour-over, the National Coffee Association recommends measuring coffee and water in grams with a digital scale rather than by tablespoon, so your ratio is the one you intended; our coffee scale picks compare options. And the bag price moves the result in direct proportion: coffee that costs twice the BLS average per pound costs twice as much per cup at the same ratio. Machine, filter and maintenance costs are a separate question; our capsule versus bean-to-cup cost formula covers those, and the coffee machine price guide explains what each price tier buys.
Monthly prices: the last 13 months
| Month | Average price per lb | Change from prior published month | Change from a year earlier | Cost per 8-oz cup (1:16) |
|---|---|---|---|---|
| August 2025 | $8.87 | +5.4% | +40.6% | $0.29 |
| September 2025 | $9.14 | +3.0% | +41.3% | $0.30 |
| October 2025 | Not published | n/a | n/a | n/a |
| November 2025 | $9.26 | +1.3% | +34.8% | $0.30 |
| December 2025 | $9.05 | -2.2% | +33.6% | $0.30 |
| January 2026 | $9.37 | +3.5% | +33.4% | $0.31 |
| February 2026 | $9.46 | +1.0% | +30.5% | $0.31 |
| March 2026 | $9.61 | +1.6% | +30.1% | $0.31 |
| April 2026 | $9.72 | +1.2% | +29.0% | $0.32 |
| May 2026 | $9.51 | -2.2% | +19.9% | $0.31 |
| June 2026 | $9.46 | -0.6% | +16.3% | $0.31 |
| July 2026 | $9.32 | -1.5% | +10.7% | $0.30 |
| August 2026 | $9.30 | -0.2% | +4.8% | $0.30 |
BLS says average prices are best used to describe the price level in a given month, so use the coffee index in the next section for trends. New figures typically arrive between the 10th and 14th of the following month.
Coffee inflation compared with food and all items
| CPI-U index | 12 months to August 2026 | January 2020 to August 2026 |
|---|---|---|
| Coffee | +6.1% | +55.6% |
| Food at home | +2.2% | +32.2% |
| All items | +3.4% | +29.9% |
These are changes in the CPI-U price indexes for coffee, for all food bought for home use, and for all consumer items, all for the U.S. city average and not seasonally adjusted. BLS describes its indexes, rather than its average prices, as the appropriate measure of price change.
Annual average prices since 1980
BLS does not publish annual averages for these prices, so each figure below is the simple average of the months BLS published that year. Years with fewer than 12 published months are labeled.
| Year | Average price per lb | In August 2026 dollars | Cost per 8-oz cup (1:16) |
|---|---|---|---|
| 2026 (8 months) | $9.47 | $9.56 | $0.31 |
| 2025 (11 months) | $8.18 | $8.51 | $0.27 |
| 2024 | $6.32 | $6.75 | $0.21 |
| 2023 | $6.16 | $6.77 | $0.20 |
| 2022 | $5.89 | $6.74 | $0.19 |
| 2021 | $4.71 | $5.82 | $0.15 |
| 2020 | $4.43 | $5.74 | $0.14 |
| 2019 (3 months) | $4.14 | $5.39 | $0.14 |
| 2018 (6 months) | $4.30 | $5.76 | $0.14 |
| 2017 | $4.45 | $6.09 | $0.15 |
| 2016 | $4.39 | $6.13 | $0.14 |
| 2015 | $4.72 | $6.67 | $0.15 |
| 2014 | $4.99 | $7.06 | $0.16 |
| 2013 | $5.45 | $7.84 | $0.18 |
| 2012 | $5.68 | $8.28 | $0.19 |
| 2011 | $5.19 | $7.72 | $0.17 |
| 2010 | $3.91 | $6.00 | $0.13 |
| 2009 (1 months) | $3.67 | $5.69 | $0.12 |
| 2007 (10 months) | $3.47 | $5.61 | $0.11 |
| 2006 | $3.20 | $5.32 | $0.10 |
| 2005 | $3.26 | $5.59 | $0.11 |
| 2004 | $2.85 | $5.05 | $0.09 |
| 2003 | $2.92 | $5.31 | $0.10 |
| 2002 | $2.92 | $5.45 | $0.10 |
| 2001 | $3.09 | $5.85 | $0.10 |
| 2000 | $3.45 | $6.71 | $0.11 |
| 1999 | $3.43 | $6.89 | $0.11 |
| 1998 | $3.77 | $7.74 | $0.12 |
| 1997 | $4.11 | $8.58 | $0.13 |
| 1996 | $3.43 | $7.33 | $0.11 |
| 1995 | $4.04 | $8.88 | $0.13 |
| 1994 | $3.40 | $7.67 | $0.11 |
| 1993 | $2.47 | $5.73 | $0.08 |
| 1992 | $2.58 | $6.15 | $0.08 |
| 1991 | $2.81 | $6.91 | $0.09 |
| 1990 | $2.97 | $7.61 | $0.10 |
| 1989 | $3.07 | $8.30 | $0.10 |
| 1988 | $2.77 | $7.84 | $0.09 |
| 1987 | $2.79 | $8.22 | $0.09 |
| 1986 | $3.43 | $10.49 | $0.11 |
| 1985 | $2.58 | $8.04 | $0.08 |
| 1984 | $2.58 | $8.31 | $0.08 |
| 1983 | $2.47 | $8.29 | $0.08 |
| 1982 | $2.52 | $8.76 | $0.08 |
| 1981 | $2.53 | $9.32 | $0.08 |
| 1980 | $3.14 | $12.80 | $0.10 |
What this data covers, and what it does not
- One product definition. The series is BLS item 717311, “Coffee, 100%, ground roast, all sizes, per lb.” It is a retail price per pound of ground coffee, not the price of a drink at a coffee shop.
- Urban U.S. average. BLS collects the prices in the 75 urban areas it prices for the CPI and publishes a U.S. city average. Your local store can be well above or below it.
- Price levels, not precise price change. BLS says its average prices are best used to measure the price level in a particular month and that its indexes are more appropriate for measuring price change. That is why the change figures on this page use the coffee index.
- One missing month. The BLS files have no October 2025 value for the average price or the CPI-U series; the average price footnote reads “Data unavailable due to the 2025 lapse in appropriations.” That month is blank in the tables, chart and download.
- Inflation adjustment. Restated prices multiply each month’s price by the ratio of the latest CPI-U all items index to that month’s index. This keeps the comparison in today’s money, but it cannot correct for changes in coffee products or package sizes over four decades.
- Cost per cup. The per-cup figures count the coffee only, at the stated ratio, and treat 1 milliliter of water as 1 gram. They leave out filters, milk, sugar, water, electricity and equipment.
Download the data and cite this page
- Data: us-coffee-prices.csv , one row per month since January 1980, with the BLS average price, the inflation-adjusted price, the cost per 8-ounce cup at 1:16, and the three CPI-U indexes.
- Chart: us-coffee-prices-chart.svg .
- Suggested credit: “Source: U.S. Bureau of Labor Statistics; calculations by Coffee Review Lab (coffeereviewlab.com).” The underlying prices are BLS series APU0000717311, so you can verify any month against BLS directly.
- Updates: BLS data last downloaded October 9, 2026. The page is rebuilt from the BLS files by a script after each monthly release, and the date at the top changes when new data arrives.
Methodology
- Download the BLS average price file for food (
ap.data.3.Food) and the CPI-U files for all items (cu.data.1.AllItems) and for food and beverages (cu.data.11.USFoodBeverage) from download.bls.gov. - Keep four series: APU0000717311 (average price of ground coffee per pound, U.S. city average), CUUR0000SA0 (CPI-U all items), CUUR0000SEFP01 (CPI-U coffee) and CUUR0000SAF11 (CPI-U food at home). All are not seasonally adjusted.
- Restate each month’s price in the latest month’s dollars: price × (latest CPI-U all items ÷ that month’s CPI-U all items).
- Convert to cups: grams per cup = 8 × 29.5735 ÷ 16; cups per pound = 453.592 ÷ grams per cup; cost per cup = price per pound ÷ cups per pound.
- Compute index changes as the percentage change between the two months’ index values. Annual averages are the mean of the published months in each year.
No figure on this page is estimated, modeled or rounded before the final step, and no data was collected by Coffee Review Lab; every number can be reproduced from the BLS files above.
Sources
- U.S. Bureau of Labor Statistics: average price of coffee, 100%, ground roast, all sizes, per lb, U.S. city average (APU0000717311)
- BLS: Average Price Data (AP) survey definition and file documentation
- BLS: average price data footnote codes
- BLS: average price data files for food (ap.data.3.Food)
- BLS: CPI-U all items data file (cu.data.1.AllItems)
- BLS: CPI-U food and beverages data file, including coffee and food at home (cu.data.11.USFoodBeverage)
- National Coffee Association: how to make pour-over coffee (coffee-to-water ratio)
- National Coffee Association: how to make French press coffee (coffee-to-water ratio)
See Also
If you want to move from general advice into actual product choices, start with Coffee Maker Guide for Hard Water: What to Check and Buy, Coffee Portafilter Basket Size Picker for Espresso, and What to Look for in a Coffee Maker with a Timer.
For a wider picture after the basics, KitchenAid Burr Coffee Grinder Review and Best Budget Coffee Machines: Three Routines, Three Honest Picks are the next places to read.